BLOG POSTS WHERE MONTH IS 4, AND DAY IS 13, AND YEAR IS 2016
DON'T SNOOZE ON SUNDAYS?
Among the many data elements on Phish.net, users' ratings of shows receive a disproportionate amount of critique. They are generic by design, suspected of some biases, and used differently by different users.* But despite their flaws, the ratings are still informative**.
We’ll start with an arcane issue: how show performance varies by day of the week. While some fans may love the Friday/Saturday blowout, many warn to “never miss a Sunday!”. Similarly the band’s “you snooze, you lose” mantra has emphasized that sparks happen in expected places on unexpected nights. An analysis of show ratings helps to consider each of these ideas, as well as to identify some interesting variations.
All at Once
First, let’s look at the ratings*** for all 1701 known shows. If we take the average rating for each show, and then average those averages by weekday, Sunday is indeed tops - with a mean average of 3.87 just edging out Friday (3.82) and Saturday (3.85). However, the averages alone don’t vary much, as the lowest (Monday, at 3.69) isn’t much lower. Meanwhile, variance (differences from the average within each group) do vary. So, let’s look at that...
Of those that have been rated, only a third have average ratings below 3.57, while a third have average ratings above 4.13. That’s stilted towards the high end, but still involves sufficient variation for comparisons. Or, treating the ratings as an indicator of performances, Phish shows are typically hot – but they’re not all equally so, and how hot they are varies, even across the week.
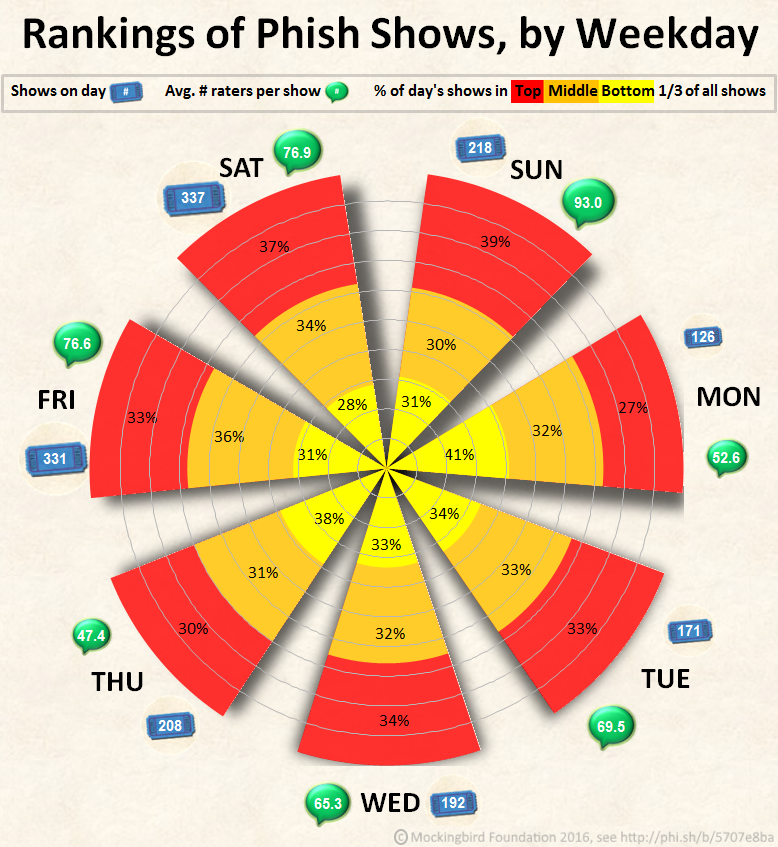
If you lose by snoozing, it’s not on Monday: 41% of Monday shows are in the bottom third, while only 27% are in the top third – respectively, the highest and lowest proportions of any in the chart. Saturday seems least risky, with the smallest proportion at the bottom (28%); but Sunday more often had the highest payoffs, with the largest proportion (39%) in the top third. Of the rest, Friday fared best, while Tuesday and Wednesday were “merely” consistent, with about a third of each day’s shows in each third of all shows.
Travel Effects
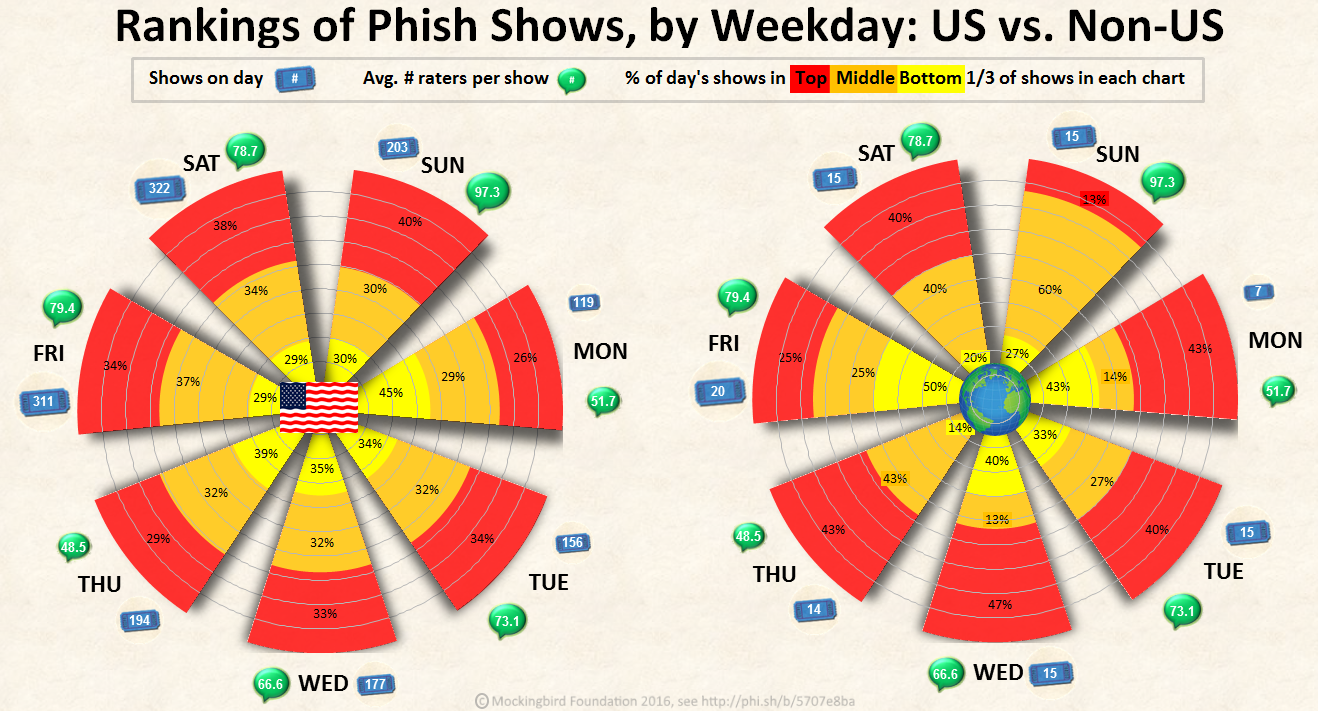
For more stark differences, compare shows within and beyond the United States. The aggregate statistics for domestic shows are close to the above. But shows outside the U.S. have either been weaker or simply judged more harshly: The top third of them have averages as low as 3.78, while the bottom third have averages all below 3.17!
Across the Eras
Finally, compare the weekly distribution of show ratings, as it changes across three eras of Phish (as commonly distinguished, with divisions at the hiatus and breakup). Even 2.0 shows have been better than non-US shows, on average, with the top third at 4.04 and above. And 3.0 shows have tended to be rated higher than 1.0 shows by small margins, whichever summary statistic is used.
But, again, the distribution across weekdays is even more pronounced: While there were far more Friday and Saturday shows in 1.0 (1983-2000), the distribution of ratings was relatively consistent across the week. 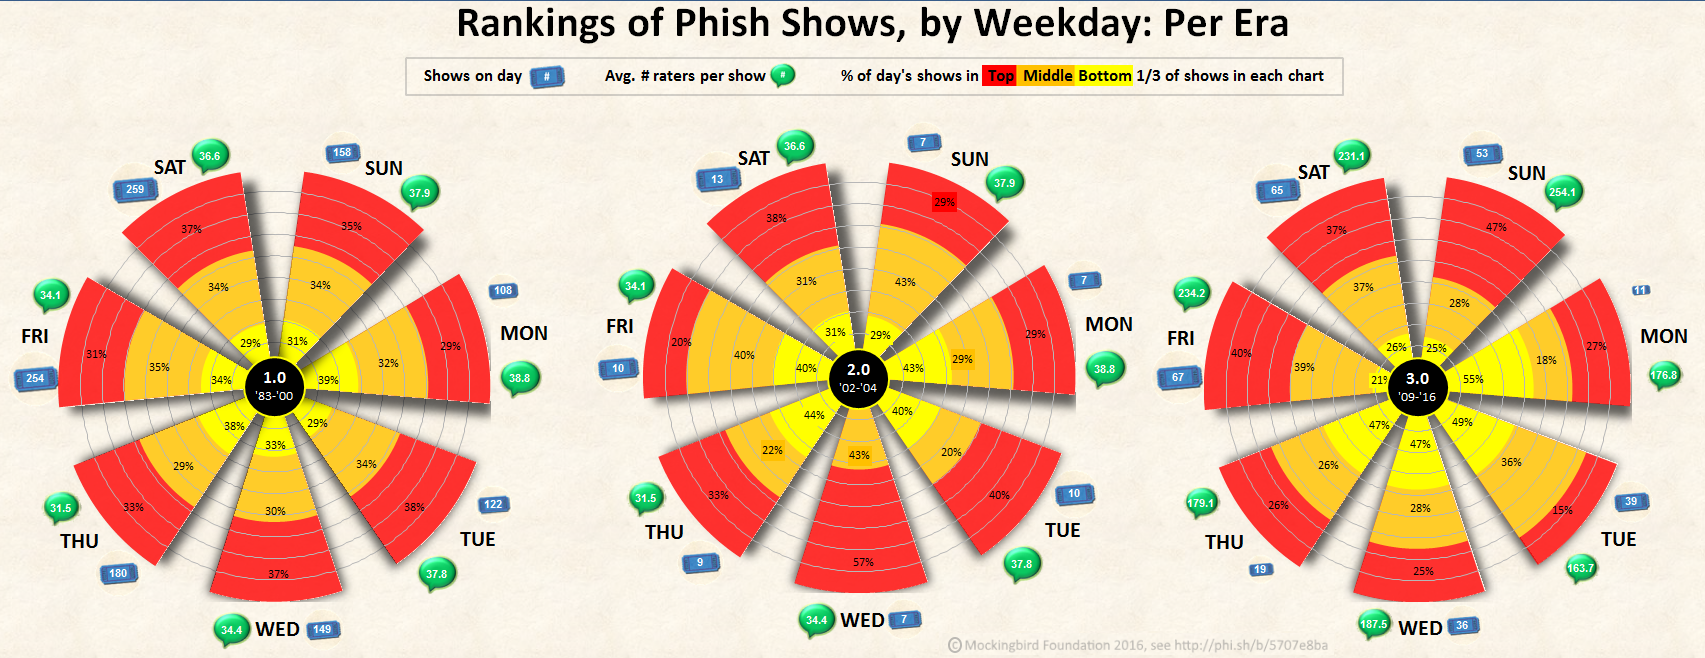
The weekend blowout is back, and you definitely shouldn't snooze on Sundays - at least, not in the U.S.
Methodological Notes
* There are three known concerns about ratings, addressed briefly here and thoroughly in coming posts:
-
First, the show ratings are a blunt instrument. Individual users might prioritize song choice(s), bustouts, overall setlist rarity, improvisational breadth (as a proportion of sound made at the show), improvisational depth (as variance from the composed notes, keys, rhythms, etc.), guest appearances, show length, venue characteristics, personal experience, esoteric characteristics or events, and/or other matters – if they discern with any clarity. Many judgements are more generalized, and some are more informed than others. Those differences are interesting - but measuring them separately would simply invite some form of combination, to provide an overall rating.
-
Second, there are some purported biases in the data, such as that a show is rated higher by actual attendees (compared to those on couch tour or listening later), by those who've seen fewer shows (which presumes that n00bs are less discerning and connoisseurs more critical), or because it occurred more recently (both from n00b bias and from a rose filter critical of the past). Some of them could potentially be incorporated into our statistical summary, but each has been addressed in previous forum posts presenting data analysis that somewhat undermines the assumptions they entertain.
-
Finally, there are known variations among raters: Some are more critical, giving only 4s and 5s, while others use the full range of available scores. The effects of differential use of the available ratings are somewhat mitigated by comparing relatively few categories, in the aggregate, across many hundreds of shows, from many thousands of ratings. Nonetheless, we are exploring variation among users and possibilities for standardizing scores per user. This blog post is the first in a series of analyses that have emerged from those investigations, and which illustrate a key point: Even without standardization, the ratings have valid meaning and uses.
** Despite flaws, the ratings are informative in three senses. Two are straightforward: They aggregate input from tens of thousands of users, about hundreds of shows. (Even the least discerning rater doesn’t give 5 stars to every show.) The third is empirical, and the point of today’s post: The show ratings are related to other variables of interest. That is, they may have predictive validity. (Similarly, you might critique DMV road tests, but they’re correlated with driving performance.)
*** All ratings data current as of April 8, 2016, at 1 a.m.
**** A stacked-petal polar chart (which might also be called a stacked circular column graph) is a dual variation on radar charts, using disconnected directional spokes, each with multiple values. (Here, bubble keys are also added for two additional variables.) Whereas the outwardly expanding widths of sector graphs (aka pie charts, et al) are subject to variable interpretation (by angle, arc, or area), concentric gridlines and series values are included here to emphasize that the salient aspect of spokes in these charts is length rather than area.
 The Mockingbird Foundation